Here is a quick visualization challenge for you.
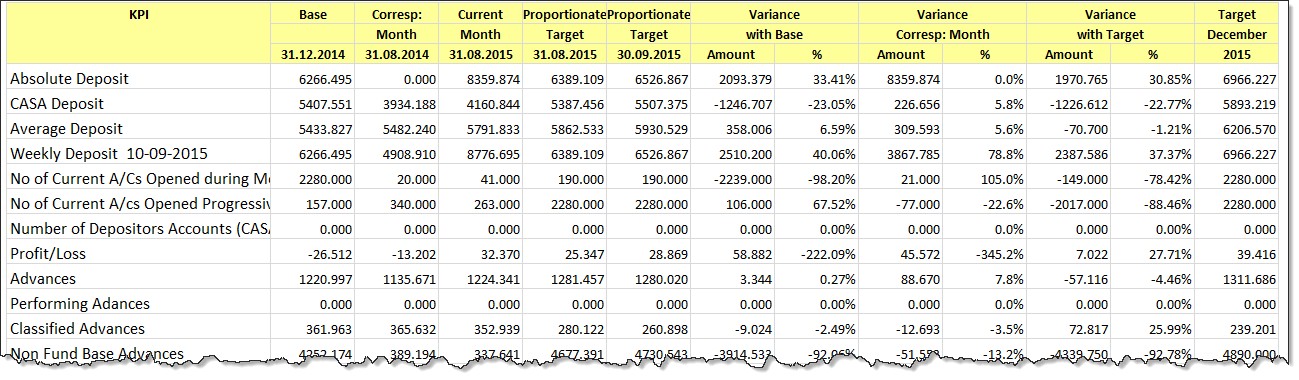
There are 25 KPIs and each has a base value, current month, corresponding month values. The KPIs also have targets.
The data looks like this:
Download the data:
Click here to download the data for this contest.
Rules for this contest:
- Visualize this data using one Excel chart (one chart per KPI is ok too).
- You may omit any any data
- You can use interactive charts.
- Do not use add-ins or VBA to make your charts
Go ahead and make your chart(s).
Last date & how to submit:
- Last date for this contest is 1st November, 2015 (Sunday).
- Once your chart is ready, email the workbook to [email protected] with the subject “KPI contest“
- Winners will be announced in 2nd week of November, 2015.
What do winners get?
After carefully reviewing all the charts, 2 winners will be selected by our panel of judges. Each of them will get $100 Amazon gift card.
So what are you waiting for. Go ahead and visualize the data and show us how awesome you are.


