direct tag

These icons are so pretty, can I get them in green? [conditional formatting trick]

One of our readers emailed this question recently,

I like the conditional formatting icons. I am trying to present some business data where going down is good. How do I get a green colored down arrow icon?

Essentially, Ms. CanIGetItInGreen wants this:

Unfortunately, Excel’s conditional formatting icons are not customizable. So we can’t get the green down arrows without some sneak. And sneak we shall. Continue reading

direct tag

direct tag

How to create animated charts in Power Point [VBA]

This is a guest post by Chirayu, a member of Chandoo.org forum.

Animating Charts in PowerPoint cannot be done without the help of 3rd party software’s that create a flash file of the chart & embed it into the presentation.

However there is a workaround for this. Save your chart as multiple images & insert them (overlapping on top of each other). Use VBA on Developer tab Controls such as Combo Box, Option Button, Check Box etc. to “Bring To Front”” the corresponding image. Thus giving the illusion of an Animated Chart in PowerPoint.

This guide will teach you how to animate the charts, using the three Developer tab Controls that were mentioned before. The code & functionality only works in Slide Show Mode. File must be saved as PowerPoint Macro-Enabled Presentation (*.pptm) Continue reading

direct tag

direct tag

CP053: Excel Data Validation for Dummies

In the 53rd session of Chandoo.org podcast, let’s talk about data validation.

What is in this session?

In this podcast,

  • What is data validation
  • How Excel DV compares with database & software DV?
  • Types of data validation rules
  • List & custom rules explained
  • Input & error messages
  • Alternatives to data validation
  • Enhancing data validation
  • Removing data validation rules
  • Homework problem for you
  • Resources & show notes

Continue reading

direct tag

direct tag

Unpivot and then pivot for clarity (case study)

Or more appropriately titled, the one where Power Query solves the problem in less time than it takes you to say Get & Transform Data.

Recently, one of my students Mr. K, sent me a pivot table problem.

Today my boss asked me “how much we paid to staff since the inception of our business with their respective date of joining?” He wanted to know, level wise summary of the last 16 years (on Quarterly / Year wise basis).

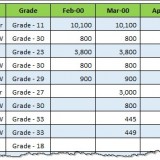
The records appended from the database month wise. Have a look to the file and give your ideas.

Mr. K’s data looked like above. Continue reading

direct tag

direct tag

Last day to join 50 Ways Analytics program – become an awesome analyst

Hi folks,

A quick announcement.

Only few hours left to join 50 ways analytics program…

As you may know, we have opened the doors for 50 ways to analyze data few days ago. This online course is designed to make you an awesome analyst.

We are closing the enrollments for this program at midnight – Pacific time, today (16th of September).

If you want to join us, please click here. Continue reading

direct tag

direct tag

direct tag

direct tag

direct tag

direct tag

Please join 50 ways to analyze data course to become an awesome analyst

Hi friends & readers of Chandoo.org,

I am very happy to invite you to our newest online class, 50 ways to analyze your data. This program makes you an awesome analyst, training you on vital skills like data analysis, data science, visualization, modeling business problems and finding best solutions.

Please click here to know more about this program & enroll.

What is this course?

50 Ways to analyze your data - an online course from Chandoo.org to make you a better analyst

It is the age of big data. Alas, what we need is big insights. But finding even small insights buried in our data is a hard task. To find the stories hidden in your data, you need to follow a process like this:

  1. Collect & clean data
  2. Structure the data
  3. Model business problems
  4. Analyze the data (or solve the problem)
  5. Visualize results
  6. Find conclusions
  7. Add layers of complexity to the problem
  8. Build what-if scenarios
  9. Reach conclusions
  10. Take action

This is where the 50 ways to analyze your data course helps. In this program, we analyze 50 familiar, important and diverse business situations using several of the above steps. Continue reading

direct tag

direct tag

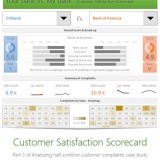
Analyzing half a million complaints – Customer Satisfaction Scorecard [Part 3 of 3]

This is the final part of our series on how to analyze half a million customer complaints. Click below links to read part 1 & 2.

  1. Complaint reason analysis – Part 1
  2. Regional trends & analysis – Part 2

Customer satisfaction scorecard

In the previous parts of this case study, we understood what kind of complaints were made and where they came from (states). For the customer satisfaction scorecard, let’s focus on individual companies. Continue reading

direct tag

direct tag

Analyzing half a million complaints – Customer Satisfaction Scorecard [Part 3 of 3]

This is the final part of our series on how to analyze half a million customer complaints. Click below links to read part 1 & 2.

  1. Complaint reason analysis – Part 1
  2. Regional trends & analysis – Part 2

Customer satisfaction scorecard

In the previous parts of this case study, we understood what kind of complaints were made and where they came from (states). For the customer satisfaction scorecard, let’s focus on individual companies. Continue reading

direct tag