direct tag

Revenue vs. Commission growth – Getting the message across [BYOD]

Situation: Our commissions are growing way faster than revenues
Let’s say you are looking revenues & sales commissions of your company for last few years. The data looks like this:

revenue-growth-vs-commission-growth-data

And you want to highlight the fact that commissions are growing faster than revenues.

So you plot YoY growth rates for revenues & commissions.

Problem: The chart of YoY growth rates is not convincing

Take a look at the chart. It doesn’t convey the message that we want. At best it says “revenue growth is less than commission growth”

revenue-growth-vs-commission-growth-problem

How to convey the message “Commission growth is a problem for us”? Continue reading

direct tag

direct tag

direct tag

direct tag

How to consolidate data that is different shapes [BYOD]

Last week, I asked my email newsletter readers to submit “one data analysis problem you are struggling with”. We called it BYOD – Bring your own data. More than 100 people have emailed various interesting (and often very difficult) problems. This week (between 16th of February to 20th of February), let’s take a look at some of these problems and solve them.

Consolidating data in different shapes

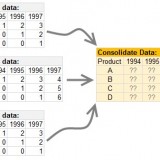
We can use either VBA or Excel’s consolidation features to combine data that has same shape (ie same number & type of columns). Here is one way to do it.

But what if we need to consolidate data that is in different shapes?

Something like above.

In such cases, we can use 3 powerful tools.

  1. Multiple Consolidation Ranges – Pivot Tables
  2. VBA
  3. Power Query

So let’s examine how to use these approaches to consolidate data in different shapes. Continue reading

direct tag

direct tag

Open Loops 2/13/2015

On Fridays I pull the best of my blog readings to share with readers. Topics can come from anywhere, and cover anything.
This week I highlight articles on

Purging your closet
The best weed trimmers
A different way of looking at cooking at home
Consist… Continue reading

direct tag

direct tag

direct tag

direct tag

direct tag

direct tag

Please join 50 ways to analyze data course to become an awesome analyst

Hi friends & readers of Chandoo.org

I am very happy to invite you to our newest online class, 50 ways to analyze your data. This program is aimed to make you an awesome analyst, training you on vital skills like data analysis, visualization of outputs, modeling business problems and finding best solutions.

Please click here to know more about this program & enroll.


What is this course?

50 Ways to analyze your data - an online course from Chandoo.org to make you a better analyst

It is the age of big data. Alas, we need big insights. But finding even small insights buried in our data is a hard task. To find the stories hidden in your data, you need to follow a process like this:

  1. Collect & clean data
  2. Structure the data
  3. Model business problems
  4. Analyze the data (or solve the problem)
  5. Visualize results
  6. Find conclusions
  7. Add layers of complexity to the problem
  8. Build what-if scenarios
  9. Reach conclusions
  10. Take action

This is where the 50 ways to analyze your data course. In this program, we analyze 50 familiar, important and diverse business situations using several of the above steps.

My goal is to make you say “YES” every-time your boss asks “Can you analyze this data and tell me what is going on?” Continue reading

direct tag

direct tag

What To Do If You’re Not Naturally Productive

9516441950_711544649d_m

One thing people assume about me is that productivity comes naturally. After all, I spend a lot of time reading and writing about it, not to mention adjusting my own methods.

Nothing could be further from the truth. I am not naturally productive.

But in spite of that, I am still highly productive. Here’s why:

The post What To Do If You’re Not Naturally Productive appeared first on Simple Productivity Blog.


More great content can be found on the site at Simple Productivity Blog., or you can find me on Twitter (@SmplProdBlog) and Facebook (Facebook.com/SimpleProductivity).


Continue reading

direct tag

direct tag

New Productivity Forms: February 2015

squiggle

In 2014 I decided I wanted to release monthly productivity forms with a seasonal theme. Fun tools make it more likely I will use them, and honestly, I get bored with the plain old print and line forms. In 2015 I decided to continue this tradition. So to that end, I will be releasing a […]

The post New Productivity Forms: February 2015 appeared first on Simple Productivity Blog.


More great content can be found on the site at Simple Productivity Blog., or you can find me on Twitter (@SmplProdBlog) and Facebook (Facebook.com/SimpleProductivity).


Continue reading

direct tag

direct tag

Open Loops 2/6/2015

On Fridays I pull the best of my blog readings to share with readers. Topics can come from anywhere, and cover anything.
This week I highlight articles on how apps keep you hooked; products whose prices will go up in 2015; how to get the best deal at t… Continue reading

direct tag