Analyzing top n (or bottom m) items is an important part of any data analysis exercise. In this article, we are going to learn Excel formulas to help you with that.
Let’s say you are the lead analyst at a large retail chain in Ohio, USA. You are looking at the latest sales data for all the 300 stores. You want to calculate the total sales of top 10 stores. Read on to learn the techniques.
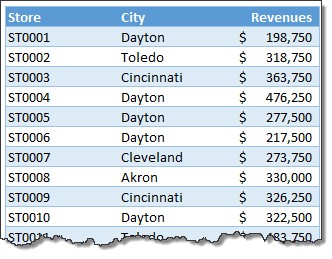
Meet the data
So here is the data we have. It is arranged in an Excel table, named Sales.
We need to answer to 2 questions.
- What is the sum of top n sales?
- What is the sum of top n sales for filtered data (say store=Dayton)?
Sum of top n sales
First let’s take a look the formula.
=SUMIFS(sales[Revenues],sales[Revenues],">="&LARGE(sales[Revenues],n))
[Related: using structural references in Excel]
How does this formula work?
There are 2 components in this formula:
- We need to sum up revenues column
- Such that, revenue >= top nth revenue
Finding the top nth value:
This is where LARGE formula helps. It looks at the revenue column and returns nth value.
Sum of top n values thru SUMIFS:
Then, SUMIFS formula calculates the total revenues where revenue >= top nth value.
[Related: Introduction to SUMIFS formula]
Sum of top n sales in filtered data
This one is tricky. First, we will add an extra column to the sales table. You can later hide this if you want.
This column just tells us whether a particular store is hidden or visible (ie filtered away or not).
Use the formula,
=SUBTOTAL(3, [@Store]) = 1 in the new column. This will be TRUE if a row is visible and FALSE if a row is filtered away.
See below illustration to understand the formula.

Next, we can use below formula to calculate the total of top n sales in filtered data:
=SUMIFS(sales[Revenues],sales[Visible?],TRUE, sales[Revenues],">="&AGGREGATE(14,5,sales[Revenues],n))
How does this formula work?
Again, we are using SUMIFS formula, but with 2 conditions.
- Store should be visible
- Revenue >= top nth revenue in visible stores
To calculate the top n value of a visible stores, we use AGGREGATE formula.
AGGREGATE(14,5,sales[Revenues],n) – what does it do?
AGGREGATE formula takes 3 or 4 parameters.
- Calculation number – 14 corresponds to LARGE
- Which data to ignore – 5 corresponds to ‘ignore hidden rows’
- Data – Sales[Revenues]
- n – optional parameter for LARGE or SMALL calculations
So, our AGGREGATE(14,5,sales[Revenues],n) formula will return top nth value among the filtered data.
Once we know that value, we just use SUMIFS to sum up all values greater than or equal to it.
Download Example Workbook
Click here to download the sum of top 10 values workbook. Play with the formulas to learn more. Also, attempt the homework problems and post your answers in comments.
Your home work – 2 challenges:
So now that you understood how to calculate sum of top n values, I have 2 home work problems.
- What is the sum of bottom 10 values excluding zero values?
- What is the sum of bottom 10 values in filtered list, excluding zeros?
Go ahead and post your answers as comments.
6 more tips on analyzing top n values
Here are few more ways to analyze with top /bottom n values.
- Sum of top 3 values that meet a criteria
- Show top 10 values in dashboards using pivot tables
- Calculating average of top 5 values
- Create a top X chart
- Highlight top 10 values using conditional formatting
- Find out nth largest value that meets a criteria using array formulas
This post is part of our Awesome August Excel Festival.


