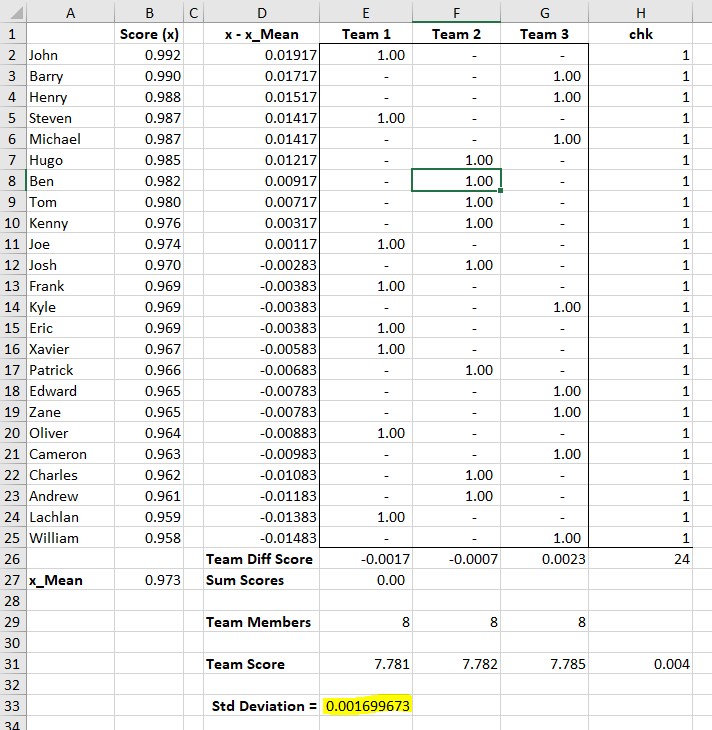
In April 2017, Shenricus, posed a question in the Chandoo.org Forums:
“I have 24 people who each have their own score. I’ve been trying to figure out how I can divide these names into 3 even teams – or as close as possible.”
I answered with a Solver Based solution, and Bosco Yip also added to my solution with a slightly different approach.
This caused me to reconsider my first attempt and finally I posted a Final Solution, which was also a Solver based solution, but was a much more robust solution than my original solution or Bosco Yip’s solution.
This post will examine the thought process used to derive the solution and then implement that using solver.
As always a Sample file is provided so you can follow along: Download Sample File here.
Approach
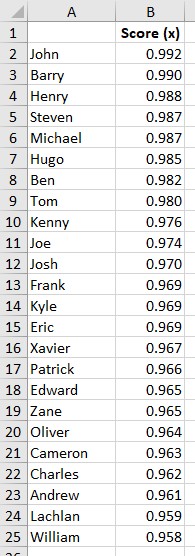
Shenricus gave us a list of 24 players and a score for each player.
The players are Ranked from Best to Worst.
We have no other information as to the Sport or Score.
The question posed by Shenricus is to distribute the players into teams so that each team is “As even as possible”.
Considering that we have 24 players and need to put them into 3 teams, we will assume each team has the same number of players and hence requires 8 players.
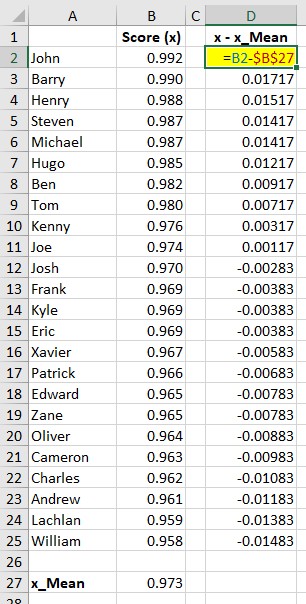
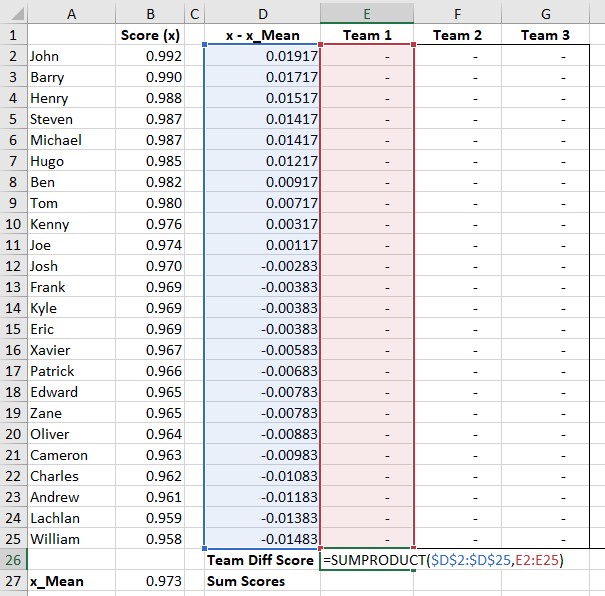
My initial though was to setup a Delta or Difference between each Players Score and the Mean (Average of all scores).
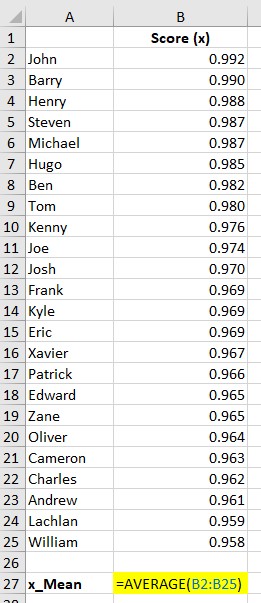
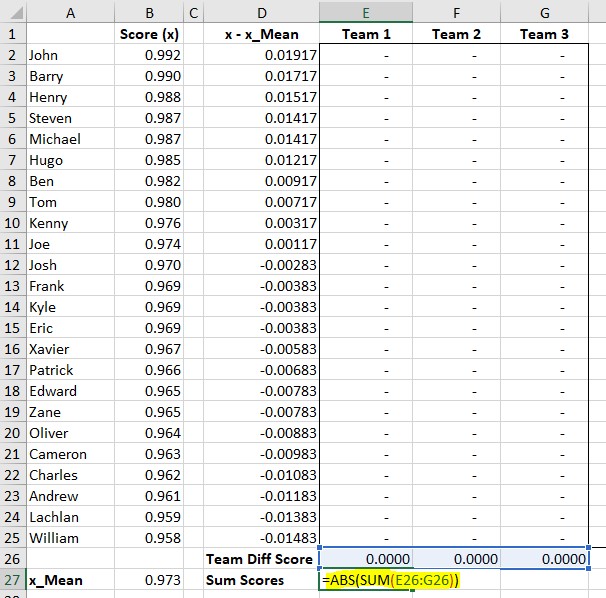
First calculate the Average of All the Scores
Then calculate the Differences between the each players Score and the Average
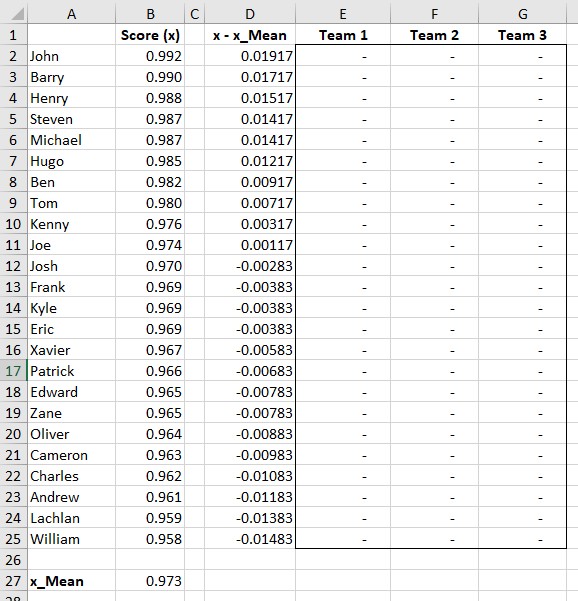
Next we need to distribute each player into one of 3 teams.
Solver will put a value of 1 when a Player is in a Team, and a 0 when the player is not in a Team.
Next add a Formula to Calculate the Sum of the Variations from Mean for each Team
and Finally Sum these up
We should be able to get Solver to Minimise this value.
So lets look at how Solver is setup.
How Do Use Solver?
Solver is found in the Data, Analyze Tab.
Your screen may look different to mine depending on which version of Excel you are using and if you have your Excel window at a maximum size or not.
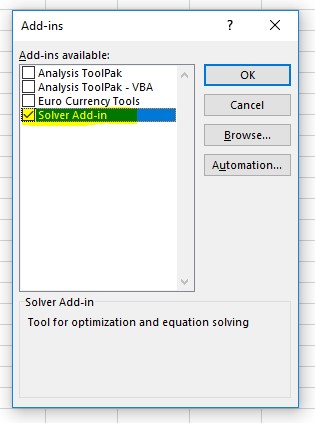
If you cannot see it, you may not have Solver Loaded.
How Do We Install Solver?
Right Click on any part of the Ribbon
Select Customize the Ribbon
Select Add-ins on the Left menu and
Manage Excel Add-ins in the Manage Dialog and press Go…
Finally Select Solver and Ok
Solver will now be visible in the Data, Analyze Tab
How Do We Setup Solver?
Click anywhere in the model
Goto the Data, Analyze Tab
Select Solver
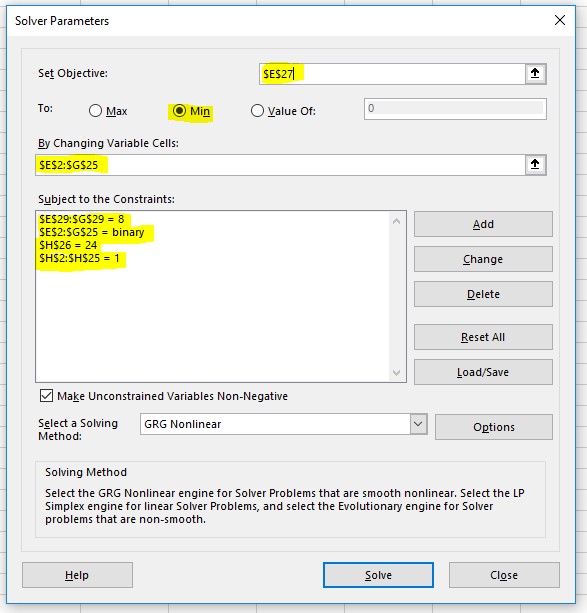
The Solver Dialog is show as:
Lets look at each of the highlighted sections first and I will discuss this first as a plain English and then I will discuss how it is implemented in Solver
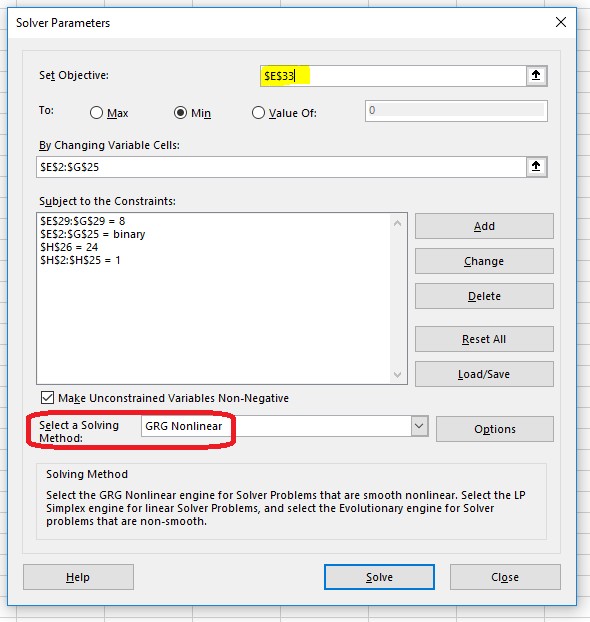
Solver is asking us to Set our Objective, to a Minimum, Maximum or Value, by changing some cells, Subject to some constraints.
Set Objective
Solver is asking what our objective is?
In our Even Teams example we want to minimise the variance in the average Team Scores
By Changing variable Cells
We want to achieve our objective by setting Each Player to be a Member of 1 team
That is Each player must have a 1 in a Column of Team 1, Team 2 or Team 3
Subject to the Constraints
We have a Number of Constraints that our model will be subject to
Each player must have a 1 in a Column of Team 1, Team 2 or Team 3
Each Team must have 8 players
All 24 Players must be used only once each
Each player can only be in a Team, he can’t be shared between teams
Solver operates using a number of techniques to Solve the above problem.
Simplistically it iterates values into the Variable Cells, subject to meeting the constraints.
It measures the output and re-iterates until a better solution is reached.
In Solver Speak
Lets look at how our model is setup in Solver
Objective
The Objective is to Minimise the Sum of the Team Scores
That is to Minimize Cell E27
Variable Cells
We will be changing the allocation of players into each team.
This is the Variable Cells $E$2:$G$25
Subject to the Constraints
The variable cells will be changed by Solver subject to meeting our 4 criteria defined above
a. That each team has 8 players, each cell in $E$29:$G$29 is 8
b. That each player only plays in 1 team, that is cells $E$2:$G$25 can only be 0 or 1 (binary)
c. That all 24 players are used, ie: $H$26 = 24
d. That all 24 players are used only once, each cell in $H$2:$H$25 = 1
We haven’t yet setup Conditions C or D above in our model yet
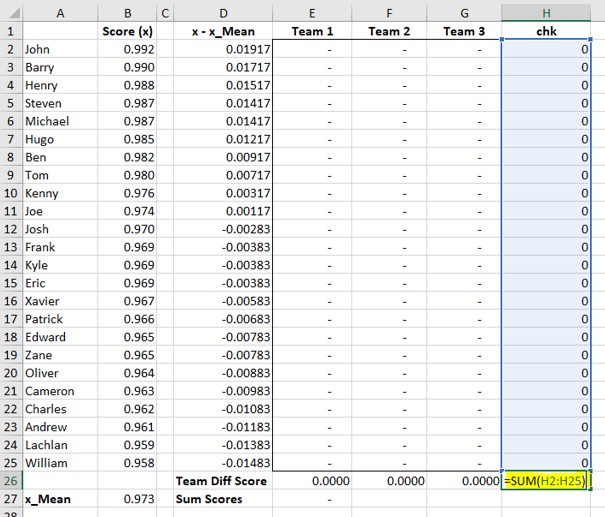
So add a Column H
H2: =Sum(E2:G2) and copy that down to Row 25
This will add the Total of each Team per Player and should be 1
And add up the total of these in H26, This is the Total of all allocated Players and should be 24
H26: =Sum(H2:H25)
In solver setup each of these sections then click Solve
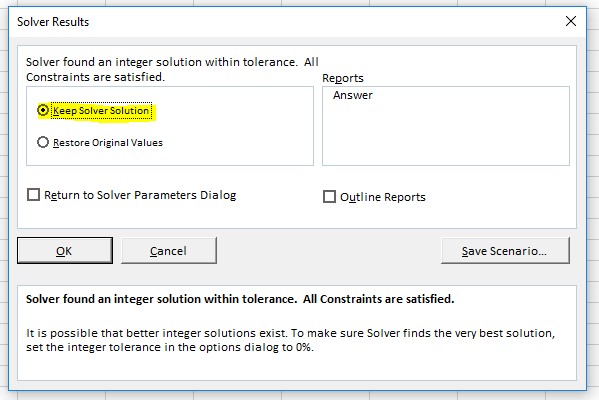
After a Minute or so, Solver will return to tell you that it has found a Solution
Lets check things
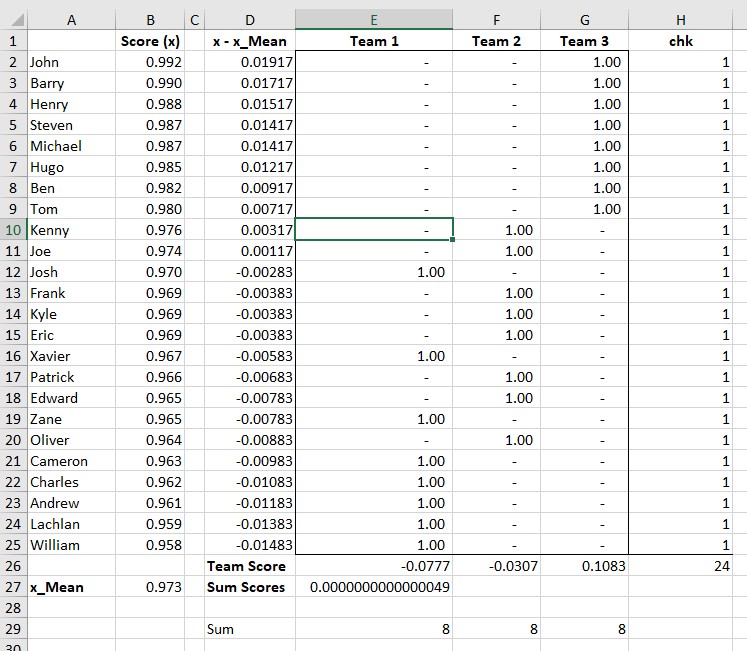
Firstly we can see that
1. The sum of the Team Scores, E27, is a very small number, as we requested
2. Each player was only used once Column H, True
3. All 24 Players were used H26, True
4. Each Team has 8 players, E29:G29, True
5. Each player is not split between teams, E2:G25, True
So all our Criteria are met, however if we start to look at the solution in more detail we can see that Team 3 has been assigned the Best 8 players, where as Team 1 has mostly the worst players, Team 2 is in the middle.
Solver has solved our problem, but our problem obviously hasn’t been correctly specified.
Solver has setup 2 teams with Low Negative Scores to Offset Team3 with a High Positive score, with the overall result being a low average Team Score
If we look at the Total Scores for each Team, E31:G31
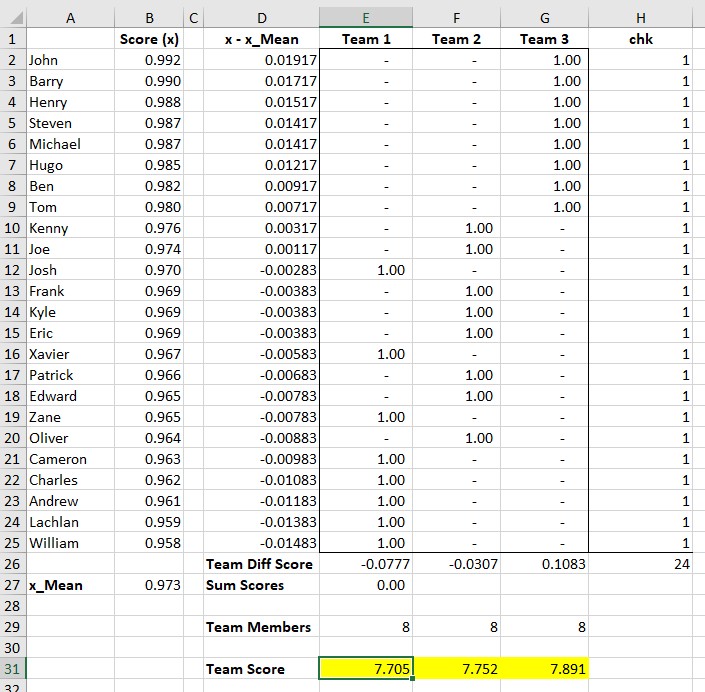
We can see that the Total Team Scores vary between 7.705 and 7.891
A spread of 0.186
What we actually need to specify is that the Variation in these Total Team Scores is Minimised. That is the spread between the 3 scores is minimised.
There are Statistical Measurements called Variance and Standard Deviation
Without going into too much detail, each is a measure of how far a set of numbers are spread out from their average value.
Refer Wikipedia Wikipedia Variance, Wikipedia Standard Deviation
Luckily we can easily calculate these using Excel
In cell E33 =STDEV.P(E31:G31)
Excel displays 0.078969
So the Standard Deviation of these 3 Team Scores is 0.0789
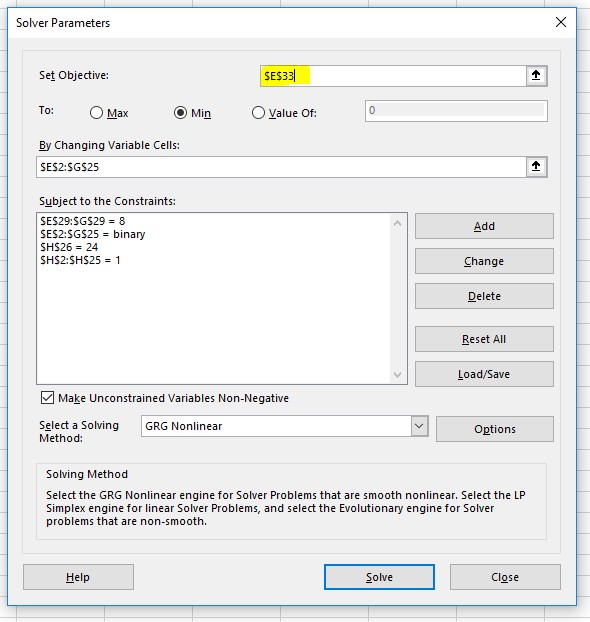
However we need to re-run the Solver Model with a new Objective
Firstly, reset all the players to 0, ie Players are not assigned to any Team
Select E2:G25 and type 0 Ctrl Enter
Click anywhere in the model,
Goto the Data, Analyze Tab
Select Solver
Set the Objective to $E$33
The Variable Cells and Constraints remain unchanged
Now Click Solve
After a minute or so, Solver will announce it has a New Solution
Accept that as before
Lets check things
Firstly we can see that
1. The sum of the Team Scores is a very small number, as we requested, Ok
2. Each player was only used once Column H, Ok
3. All 24 Players were used H26, Ok
4. Each Team has 8 players, E29:G29, Ok
5. Each player is not split between teams, E2:G25, Ok
If we look at the solution in more detail we can see that
The three Teams now have a spread of both good and not so good players
But the important thing to notice is that the Standard Deviation of the 3 Team Scores is now 0.001699, or 2.1% of the previous Standard Deviation.
This shows the teams are much more “Evenly” matched
Solver has solved our problem.
Bosco’s Solution
During the thread Bosco proposed an alternative, algebraic solution.
It involved distributing players according to simple rules
The team who got the Best player also took the worst player,
The next team who got the Second best player also took the second worst player
The next team who got the Third best player also took the third worst player, etc
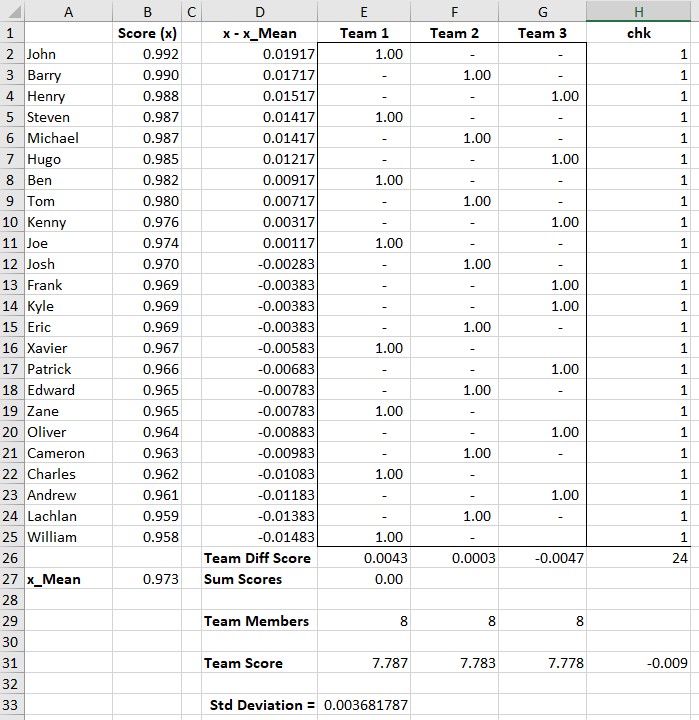
This is shown:
We can see that it also meets all of the constraints of the model, but has a Standard Deviation 0.00368, that isn’t as low as the Solver solution 0.001699.
What are these Other Solving Methods?
When you were setting up Solver you may have noticed a dialog asking, Select a Solving Method:
The best discussion I have found on these alternative Solver Techniques is shown on the link below
http://www.engineerexcel.com/excel-solver-solving-method-choose/
Closing
We can see how Solver has been used to distribute players according to player ratings and even out teams.
Unfortunately, Shenicus never came back to the forums and so we don’t know how his teams went ?
How have you distributed players or anything else ensuring things are even ?
Let us know in the comments below:

