Last week, we talked about how to copy and paste visible cells alone (ie exclude any filtered rows or hidden columns etc.) In the comments section many of you suggested two more ways to deal with this annoying problem. Let’s take a look them. Continue reading
Category Archives: Productivity
Copy & paste visible cells only [Excel Trick]
Here is something annoying with Excel.
Open any Excel file with few columns of data. Hide some of those columns (select the columns and press CTRL+0). Now, copy a few rows of data. Paste it else where. Excel will paste the values in hidden columns too. We thought Excel would omit the values in hidden columns.
What the filter Excel?!? I thought we were friends, but you annoy me with some of these quirks. Continue reading
Awesome chart to visualize Salary Increases for 3,500+ people [Tutorial]
Game for some charting awesomeness?
Off late, I have been doing a lot of data analysis and visualization on performance ratings, salary hike, gender pay equality etc. Today let me share you an awesome way to visualize massive amounts of data.
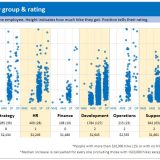
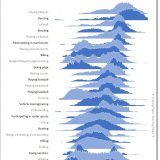
Scenario: Your organization of 3,686 people recently went thru annual performance ratings & review process. At the end of it, everyone was offered some salary increase (from $0 to $24,000 per year). You have 7 business groups. How do you tell the story of all these salary hikes in one chart?
How about the one above?
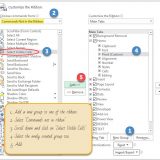
Ready to know how to create this in Excel? Read on. Continue reading
Employee Performance Panel Charts in Power BI with R
Yesterday we saw a beautiful example of panel charts with R. Today let me show you how to create the same (or even better) with Power BI & R. What you need: Power BI Desktop and R Raw data set – rem-data.csv Creating Panel Charts in Power BI with R Load CSV data in to […] Continue reading
Employee Performance Panel Charts – Excel vs. R [video]
Recently, I had to make a bunch of panel charts. After wrangling with Excel (and a tiny bit of VBA) to create them, I wondered if we are suffering needlessly by being too loyal to Excel. I switched to R and could create these panel charts in almost no time (well, first I had to learn how to pivot the data using dplyr). Today, let me share the experience. Continue reading
Use File > Info to quickly unprotect multiple worksheets [Quick tips]
Ever had a workbook with multiple protected worksheets? May be you are enterprise architect at Death Star or chief strategist at Mordor and got all the plans in a tidy little but protected workbook. Of course, you hate having to unprotect many of the worksheets every time you have a new evil plan for world domination. Don’t you worry, you can use this handy little trick to unproect en masse.
- Just open the workbook
- Go to File > Info
- Right on the top, you can see all protected worksheets and a link to unprotect them.
- Click to unprotect the ones you want to.
- Done.
Extract currency amounts from text – Power Query Tutorial
Let’s say you got some text values and want to extract the amounts from them. Something like above.
How to go about it?
We could use a variety of techniques to extract the values.
- Formulas – not easy given the unstructured nature of data. But almost possible. See this for an example.
- VBA – possible, read this forum discussion few ways to do it.
- Power Query – at first glance it might seem tricky, but PQ makes this all too easy. Read on.
Joyplot in Excel
Over on Twitter, I came across this beautiful chart, aptly titled – Joyplot. It is the kind of chart that makes you all curious and awed. So I did what any Excel nerd would do. Recreated it in Excel of course. This post takes you thru the process.
Take a look at final outcome above. Read on to learn more. Continue reading
How to add a lot of Goal Seeking to a model
Recently in the Chandoo.org Forums, MR06 asked the question, “I am trying to create a sensitivity table that tells me what amount of equity I need to include in a deal in order to get a fixed IRR as the year 3 sales price changes.” MR06 was using Goal Seek to change the equity input […] Continue reading
Rounding time to nearest minute or quarter hour etc. [formulas]
The other day, I was building a spreadsheet to calculate FTE (full time equivalent) for staff based on hours worked on various days in a fortnight. While building the spreadsheet, I came across an interesting problem. Rounding Time to nearest minute. We can’t use ROUND() or MROUND() to round time as these formulas aren’t designed to work with time values. Although time values are technically decimal, rounding time to nearest minute (or quarter hour etc.) can be tricky when usual round formulas. Let me share a few formulas to round time to nearest point.
Let’s say you have a time value (either user input or calculated) in cell A1.
Use below formulas to round time in A1. Continue reading