Let’s start the new year with a bang.
Excel Tables were introduced more than a decade ago, but a lot of people don’t know them or under utilize them. So start this year by becoming a very table genius.
What is Excel Table?
Excel tables are a simple and elegant way to structure and store your data. Let’s say you have staff details like below. Instead of calling it like A1:E72, you can convert this data in to a table and call it, you guessed it right, covfefe (or more coherent option like – staff).

So how to use tables?
Simple, select any cell in your data and press the big button.
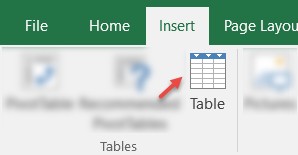
To use a table:
- Select any cell in your data
- Press CTRL + T or click on Insert > Table
- Bingo, your data is now a table.
Excel will name this table as Table3 or something like that. Just use Design tab to rename the table to whatever you want.
But why use tables at all?
Tables offer many powerful data analysis, reporting and storage features.
- Structure and format the data: As soon as you turn your data in to a table, Excel will apply several quick formatting rules to your data. This simplifies how you enter, read and understand your data. Also, tables are logical structures to store your data. So when you add data at the end of table, the formatting and range for the table automatically extends.
- Use structural references: If your data is in tabular format, you can apply structural referencing to write formulas. This is so much simpler than cell address based referencing of data. For example, to count number of staff at Manager level, you can use this formula:
=COUNTIFS(staff[Manager?],”Manager”)Tutorial: All you need to know about structural references and table formulas. - Apply sub-totals and filters with ease: You can add a total row to any table to show various kinds of totals (sum, count, average etc.) for the displayed data. If you filter, update or add to your table, the totals change too.
- Slice your data: Starting with Excel 2013, you can apply slicers to Excel tables. This way you can visually filter your data with ease.Tutorial: All about Excel slicers
- Connect multiple tables with relationships: Starting Excel 2013, you can connect multiple tables just like a database. Once you have a data model like this in Excel, you can create powerful and insightful connected pivot tables too. Learn all about table relationship feature.
- Send tabular data to Power Pivot, Power Query or Power BI with ease: Tabular data can be easily accessed by power tools like Power Pivot for Excel, Power Query (Get & Transform Data) and Power BI. This liberates your Excel data and enables powerful data clean up, analysis and visualizations.
- Analyze data without hassle: If you create a pivot table from tabular data, then any changes to table are available to pivots automatically. You just need to refresh the pivot reports to see updated summaries. Learn more about Excel pivot tables.
- Visualize data with ease: If you create a chart from tabular data, then anytime your table is updated (add new rows, delete rows or update data), then your chart is updated automatically. This enables powerful interactive and dynamic charting experiences for your users. Check out below dynamic chart examples.
Become a table genius then…
Press your big button without hesitation (or simply use CTRL+T) to enter the awesome world of tables. Check out below tutorials and tips to guide you along the way.
- Start with introduction to Excel tables
- Learn all about structural referencing
- Connect multiple tables with relationships
- Using VLOOKUP and other formulas with tables
- Customize table styles
Are you a #TableGenius?
Are you #XLTableGenius? Go ahead and thump your chest and let the world know. Tweet with #XLTableGenius and post comments about how you rock the world with tables.


